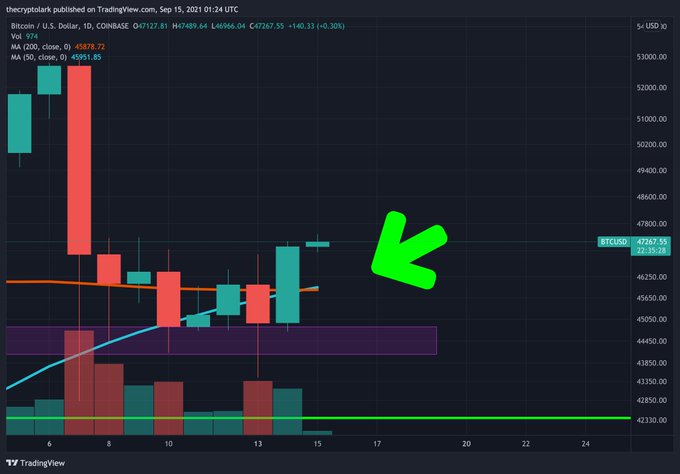
Bitcoin (BTC) was up by 3.82% in the last 24 hours to hit $47,011 during intraday trading, according to CoinMarketCap. The surge of price pushed the leading cryptocurrency above the 200-day moving average (MA).
Market analyst Lark Davis explained:
“Bitcoin daily close back above the 200 day MA and the golden cross confirmed.”
The 200-day MA is a key technical indicator used to determine the general market trend. It is a line that shows the average closing price for the last 200 days or roughly 40 weeks of trading. A surge above this indicator shows the start of an uptrend.
On the other hand, the golden cross happens when a short-term moving average crosses over a major long-term moving average to the upside and is usually interpreted by analysts as an upward turn in a market.
On-chain analyst Will Clemente believes with the 200-days MA crossed, Bitcoin needs to break resistance between $47,000 to $47,150 before experiencing a surge towards $50.5K.
Is Bitcoin facing a breakout?
According to market analyst Ali Martinez:
“Four reasons why Bitcoin could breakout: 1) 3.2K long BTC positions were created at Bitfinex. 2) Addresses with 10K to 100K BTC purchased 60K BTC. 3) 80K BTC withdrawn from known crypto exchanges wallets. 4) Large transactions volume on the BTC network surpassed $451 billion.”
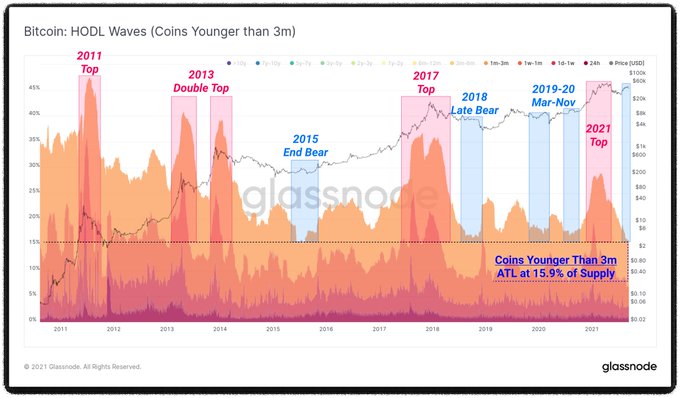
Meanwhile, 93% of Bitcoin’s supply hasn’t moved for a month, and this is a metric that shows bullish supply dynamics. Davis echoed these sentiments and said:
“We just hit a new all-time low for young Bitcoin (under 3 months) HODL wave. This often signals the end of a bearish period and is often a time when big money accumulates.”
Nevertheless, Veteran trader Peter Brandt recently cautioned against the “fear of missing out” (FOMO) trading in the present Bitcoin market, warning that the market was not yet in a bull run based on the congestion taking place.
Image source: Shutterstock


